Contact Lenses: Enhancing the comfort
The importance of contact lens characterization
Why do wearers consider “soft” contact lenses (CLs) more comfortable than the “rigid” gas permeable (RGP) alternative? Thus, what does “comfort” mean from a scientific point of view? In this short article, we aim to emphasize the significance of meticulously characterizing and monitoring the physical parameters of CL materials to enhance the comfort during their wear.
In the present era, rigid gas permeable (RGP) contact lenses (CLs) account for only 10% of the CLs market, which is instead predominantly covered by soft CLs1. The strengths of soft CLs reside in their biocompatibility with the ocular environment, outstanding optical transparency, and hydrophilicity.2
The hydrophilicity of a CL plays a crucial role in maintaining the pre-lens stability of the tear film, which is essential for proper hydration and lubrication. Instability of tear film, and decreased drainage of protein or lipid often result in inadequate cleansing, immune reaction and heightened friction between the eyelid and CL surface, resulting in irritation and discomfort for the users3.
As evident, every physical property of a CL material is interconnected, influencing the overall comfort experienced during wear. A comprehensive physico-chemical characterization of the different materials is paramount to guarantee a comfortable and fully functional product for consumers.
Part of the research done in CeRCA Lab, located at the Department of Mathematics and Physics “E. De Giorgi” at the University of Salento (Italy, LE), is on characterization techniques to understand the physico-chemical behaviour both of soft and rigid gas-permeable CLs. The aim of this article is to give an introduction on most used techniques indicated to characterize some of properties of contact lens materials.
The cornea must breathe! (oxygen permeability)
One of the earliest challenges encountered in the development of CL materials is oxygen permeability. This is crucial physical parameter for monitoring the amount of oxygen reaching the cornea through the CL from the surrounding atmosphere. The governing physical law for the diffusion process is the Fick’s law, and oxygen flow through CLs is typically quantified by the product of the diffusion coefficient (D) and the material solubility (k), i.e., Dk–. This value can be quantified by using the coulometric or the polarographic method. In the first one, two chambers filled with oxygen and nitrogen respectively are separated by a CL; the amount of oxygen that can diffuse through the CLs is detected in correspondence with the nitrogen-chamber. In the polarographic method, the CL is positioned on a polarographic cell (Fig. 1); each oxygen atom passing through the lens is detected by an electric current generated through an electrochemical process between two electrodes located on the cell surface.
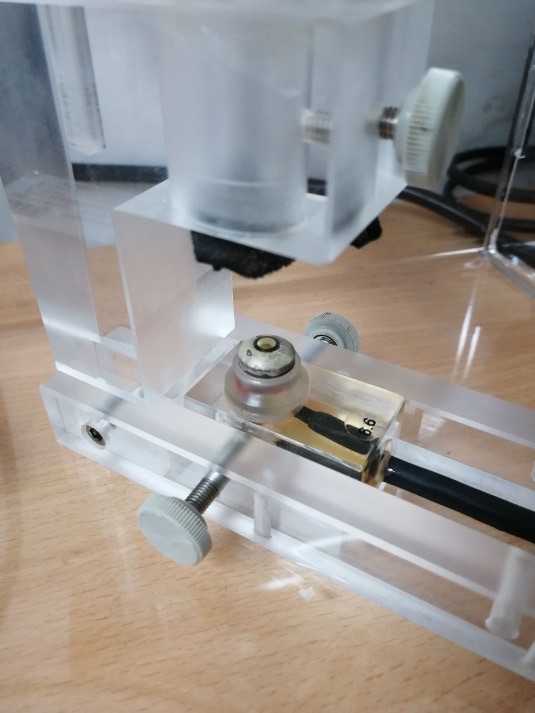
At the CERCA lab, the detection of the oxygen permeability of CLs can be conducted by using a 201T Permeometer, composed of a Rehder SSTS cell and a Polarographic Dk cell from Createch Rehder Development Company.
Better if hydrophilic (wettability)
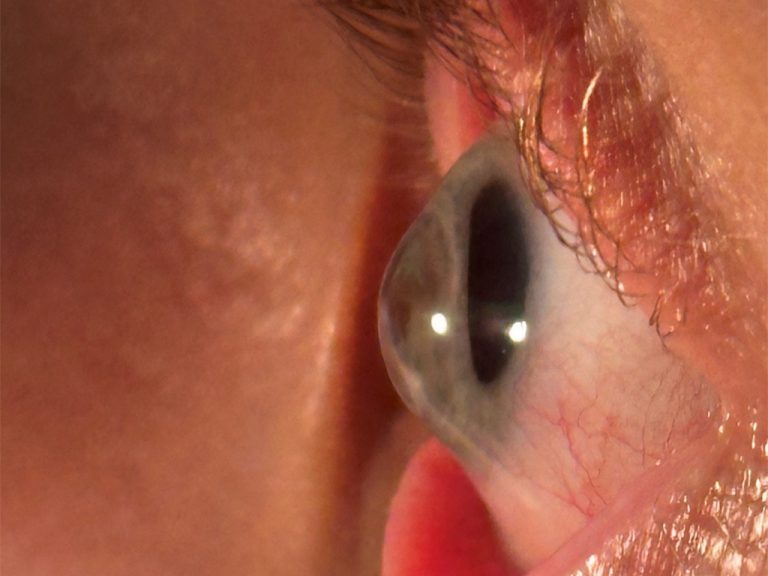
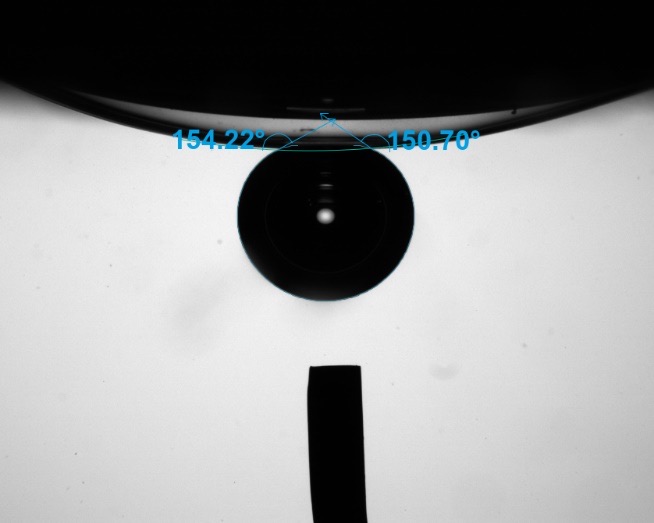
When a liquid droplet falls onto a solid surface, it can either spread and wet the surface or maintain a spheric shape in equilibrium. The former behaviour is characteristic of hydrophilic surfaces, while the latter occurs on hydrophobic surfaces. In scientific terms, this phenomenon is referred to as the wettability of a surface and, from the physico-chemical point of view, it involves cohesion forces between liquid-liquid atoms and adhesion forces between solid-liquid atoms. Experimentally, the surface attitude to be wetted by a liquid can be determined by measuring the contact angle (CA), namely, the angle formed between the solid surface and the tangent to the liquid droplet at the three-phase contact point, where air, liquid, and solid phases coexist. In general, a material is considered hydrophilic if CA < 90° (e.g. paper or glass), and hydrophobic if CA > 90°, (e.g. polyethylene terephthalate (TEFLON)), and superhydrophobic if CA > 150° (e.g. lotus leaf).
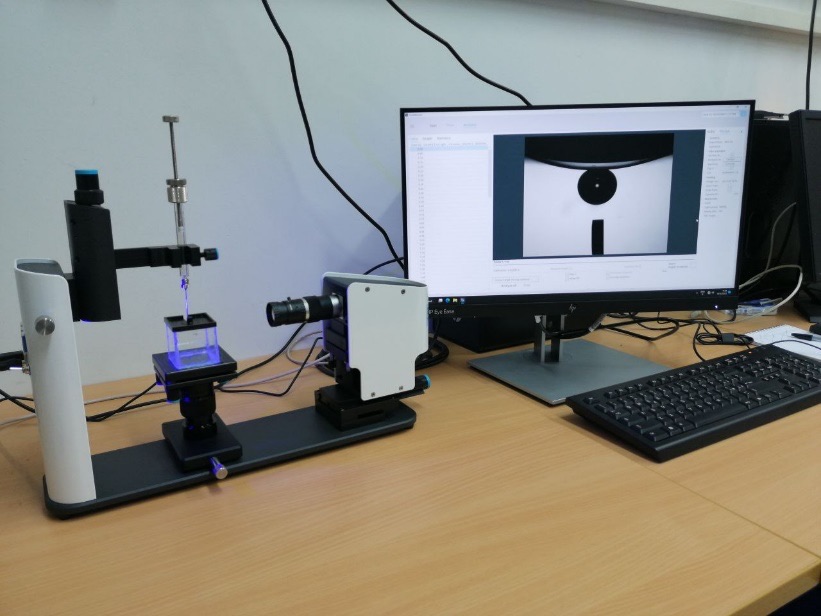
The sessile drop method, involving the deposition of a liquid droplet on the surface of interest to measure the CA through optical images recorded by means of optical tensiometers1, is the most widely used approach to evaluate the CA on a surface (see Fig. 2). Conversely, the captive bubble technique is more suitable for evaluating CA in high hydrophilic materials like hydrogels-based CLs. It entails depositing an air bubble on a surface placed upside down under complete immersion in standard liquid (see Fig. 2). In this case, the measured angle must be subtracted from the straight angle (180°) to obtain the CA for the surface of interest.
Generally, hydrophilic CLs surfaces facilitate better tear film spreading, leading to effective lubrication during the blinking process. On the other hand, hydrophobic CLs surfaces tend to dry more quickly.
The CeRCA laboratory is equipped with the Theta Lite Optical tensiometer from Biolin Scientific, which is capable of detecting the contact angle and surface free energy.
Blinking discomfort (coefficient of friction)
The challenge of moving one surface over another is directly associated with friction, a force that resists such movement. The coefficient of friction (CoF) quantifies the difficulty of this movement for the same applied forces: a higher CoF indicates greater difficulty and wear on the involved surfaces. In our case of interest, in ocular environment, the two involved surfaces during a blink are the inner eyelid (in particular the lid wiper) and the anterior CL surface3. Recent studies have identified high CoF values as a significant factor leading to discomfort in CL users, commonly referred in scientific literature as Contact Lens Discomfort (CLD). Presently, there are no standardized assessments for CL friction, and published values vary over three orders of magnitude (see Fig. 3, left). The scientific community is still debating whether the analysis should be conducted at high sliding speeds, comparable to those encountered during blinking movements, or at low speeds to establish an upper limit in friction values specific to a particular CL.
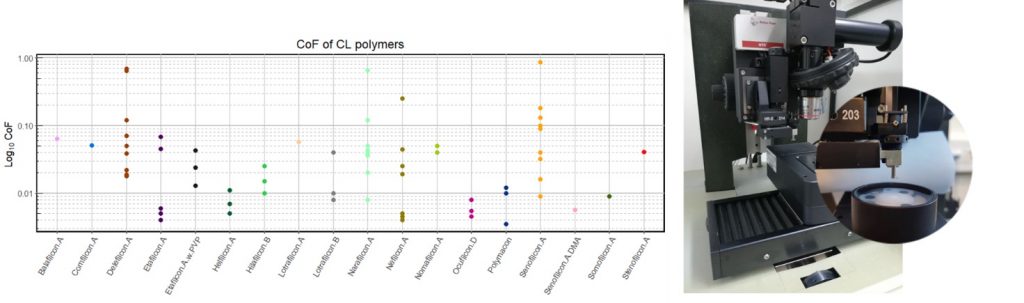
The CeRCA laboratory is equipped with a NTR3 Nanotribometer from Anton Paar (see Fig. 3, right), an instrument that enables the measurement of CoF at extremely low sliding speeds (on the order of 100µm/s) in both air and liquid conditions.
Role of nanometric feature on the CL surface
What is the structure of a CL at the nanometric scale? What kind of implication does it have on discomfort?
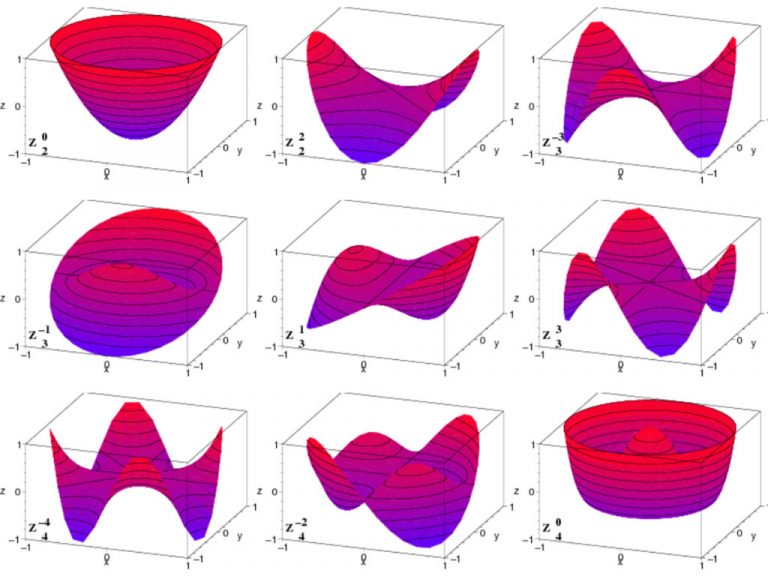
Advancements in CLs materials remain a crucial focus, as the effectiveness and comfort of this devices are inherently related to surface structure of the material used. The roughness parameter plays a key role, in fact a smooth surface is imperative for the optical quality of a contact lens, as minimized scattered light enhances the performance of the optical system. Furthermore, surface roughness must be taken into account, as deposits are more prone to form on imperfections of the lens surface. Studies have demonstrated that higher surface roughness increases the risk of biofilm development on the CL surfaces, and the transfer of bacteria from a CL is influenced by the roughness (and hydrophobicity).
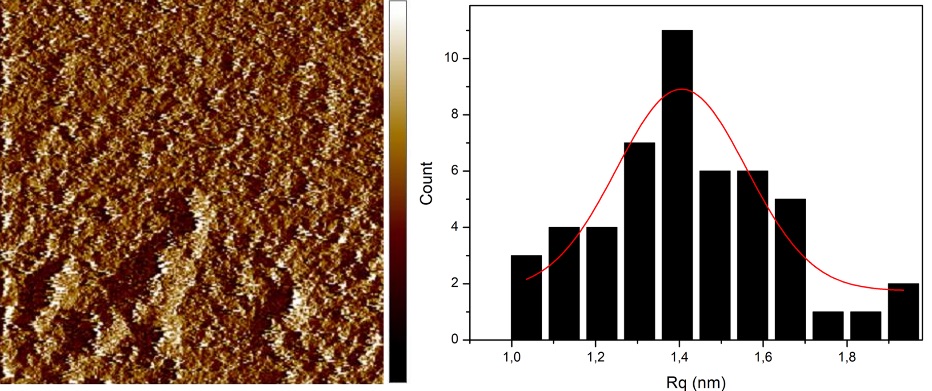
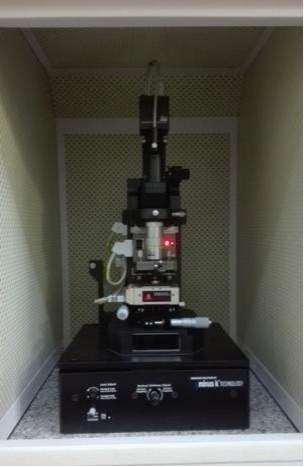
The Atomic Force Microscopy (AFM) consists of a sharp tip (probe) with a radius in the order of nanometers fixed to a free end of an elastic cantilever. When the tip scans the material, the cantilever deflection changes according to Hooke’s law in response to Van der Walls potential (that consider the repulsion or adhesion forces between the probe and the material surface). Fine detection performed by a laser beam of the cantilever deflection provides topography and roughness information (see Fig. 4). The CeRCA laboratory is equipped with the XE70 Park AFM.
Elastic or rigid? (Young’s modulus)
Mechanical analysis of a material involves subjecting a material to stress forces under compression, tension, and shear tests. The elastic behaviour allows scientists to evaluate handling and durability of a CL. Tensile analysis produce a stress/strain curve (see Fig. 5, left), which shows the resistance of a material to a deformation (strain) caused by a force (stress). A useful parameter is the Young’s modulus (Y), slope of the stress/strain curve in the linear region of the diagram. The maximum elongation is another useful parameter extractable from this kind of analysis, showing the maximum stress that can be sustained by the device before encountering a breakup5. Moreover, the resistance of a CL under stress changes if it is fully wetted by the tear film or in dry conditions. The mechanical tensiometer installed at the CeRCA laboratory, Univert Test Device from World Precision Instruments, allows to detect the Young’s modulus and perform compression tests in liquid environment, also maintaining temperatures like those in the ocular environment.
Conclusions
Every physico-chemical aspect of contact lens materials plays an important role on contact lens performance. We have highlighted the main subset physical key parameters that prove valuable in the experimental performance evaluation of CLs. A comprehensive understanding can only be achieved by employing different characterization techniques, each of equal significance. This is the mission of our research centre.
CERCA Lab (Advanced contact lens research centre) at the University of Salento, Lecce, Italy. The references are available on request from the editorial office.