State of the Art(ificial): Part 2

Understanding Soft Lens Design & Fitting
Celebrating 50 years of EFCLIN, urges us to look back – but also gives us a good opportunity to look forward. Artificial intelligence (AI) is getting a lot of attention lately, almost to the point of becoming a fashion statement: everybody is into artificial intelligence, it seems. Several recent articles, including one by Hood et1 al and Huang et al2 in leading journals in our field show that big data and AI will become important within the field of eyecare too. This article looked at using optical coherence tomography (OCT) images of the retina to create a reference database for glaucoma detection; if you create databases with images of thousands of healthy eyes, it is not too difficult to see what is normal and what is not. The same has been successfully applied to detect diabetic retinopathy and ocular hypertension. It seems that (objective) technology can be better than (subjective) human beings at detecting anomalies.
How about our contact lens industry? Guess what? We are very much underway in the same direction, perhaps without always realising it. Look at myopia management (comparing a myopic kid’s eyes to a database of age-matched controls) or at keratoconus detection (the indices marked in ‘red’ or ‘green’ on the corneal topography map indicate whether a cornea is abnormal or not). But it’s not just with detection; in fitting contact lenses, large databases can also be used to predict outcomes. Maybe not always to allow ‘self-learning’ yet – but that would be the logical next step. Let’s see where we are right now in our industry, a state of the art(ificial) with regard to contact lens fitting. In the first part, we looked at rigid corneal lenses, ortho-k and sclerals; in this article, we will focus solely on soft lens fitting.
Alignment
How do we best align a large lens made of a soft hydrophilic material with a more rigid surface (the anterior ocular shape)? In part 1, we focused on using microns of height in our contact lens industry to define both the lens and the surface. We can do the same for soft lenses: much of this comes from knowledge we gained in the last decade or so about scleral lens fitting. In a way, fitting a soft lens is like fitting a scleral lens that is made out of a highly flexible material. Many scleral lens trial sets are defined in microns of height, and changes in scleral lens fits are often defined as ‘x’ flatter or steeper in microns, with some using tangent angles. And the amount of vault over the ocular surface (the fluid reservoir thickness) centrally (typically 150-350) and peripherally (20-100) are all marked in microns, and even the amount of ‘settling’ is set to about 50-100 microns. So, let’s use microns as the metric for defining the ocular surface shape first (the workbench) and then try to match what the soft contact lens values are (the tools) in sagittal height (CL-SAG, also in microns).
The Soft Lens Workbench
The soft lens workbench is obviously quite a bit larger than the corneal and ortho-k lens workbench. Typically, a soft lens is 14.2 mm in diameter on average. One could take that, the average lens diameter, as a reference point; or one could argue that as different lenses have different diameters, and a lens moves on the eye by about 0.2 mm or 0.3 mm (on either side), then the overall area where the soft lens lands on the eye is about 15 mm. This chord has been used traditionally in the past for scleral lens fitting purposes, at least to distinguish between ‘normal eyes’ and out-of-standard eyes as the main reference point.
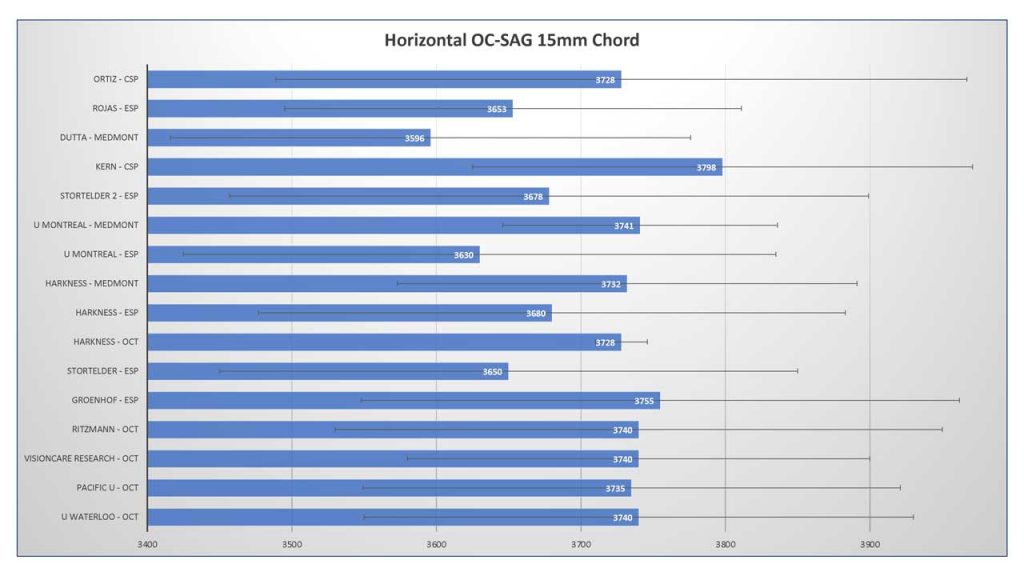
What we can see in the bar graph (figure 1) is that several small-size studies have looked at this – using the horizontal ocular sagittal height (OC-SAG) over a 15 mm chord 3,4,5,6,7,8,9,10,11,12,13,14. What is interesting is that the absolute values among studies do not differ much from a scientific standpoint, especially given that these studies used different technology (anterior segment OCT, Pentacam, profilometry and Medmont corneal topography extrapolation). The mean OC-SAG value is around 3700 microns, and the maximum difference between the highest OC-SAG and the lowest OC-SAG in these 15 studies is no more than 202 microns. Whether that is relevant in practice or not is a different question and is up for discussion.
So, assuming we can measure the anterior ocular surface one way or the other, how can we find a lens that best aligns to that? We know roughly what the average eye looks like (an OC-SAG of around 3700 microns over a horizontal 15 mm chord), and we also know that the standard deviation (marked with whiskers in the graph in figure 1) is about 175 microns typically on average. That means that 68% of eyes would be between the values of roughly 3500 and 3900 microns. These would be our ‘normal eyes,’ and likely, most standard soft lenses would fit on these normal eyes from an alignment point of view. Finding NEMOs (normal eyes measured ocular surfaces) may therefore be one of our most important first goals when fitting soft lenses.
Tools
Previous calculations at Pacific University have found that about 68% to 78% of eyes can be fitted based on the known OC-SAG values compared to the CL-SAG values we currently have. That means that roughly 25% of eyes would benefit from an ‘out-of-standard’ lens design.
What do we further know about our tools – the current lenses we put on eyes? Studies at Pacific University report the CL-SAG values of a cohort of lenses at 20 °C (room temperature), the temperature that has been set by the ISO standards for lens parameters. More recent studies from Pacific University indicate, though, that a lens shrinks on the eye (diameter and OC-SAG values get smaller) when it goes from room temperature (the blister) to eye temperature (34 °C).15 The amount is about 3% but varies with material (more effect with high-water-content lenses). But let’s keep it ‘simple’ for now and stick to the 20 °C values that we have.
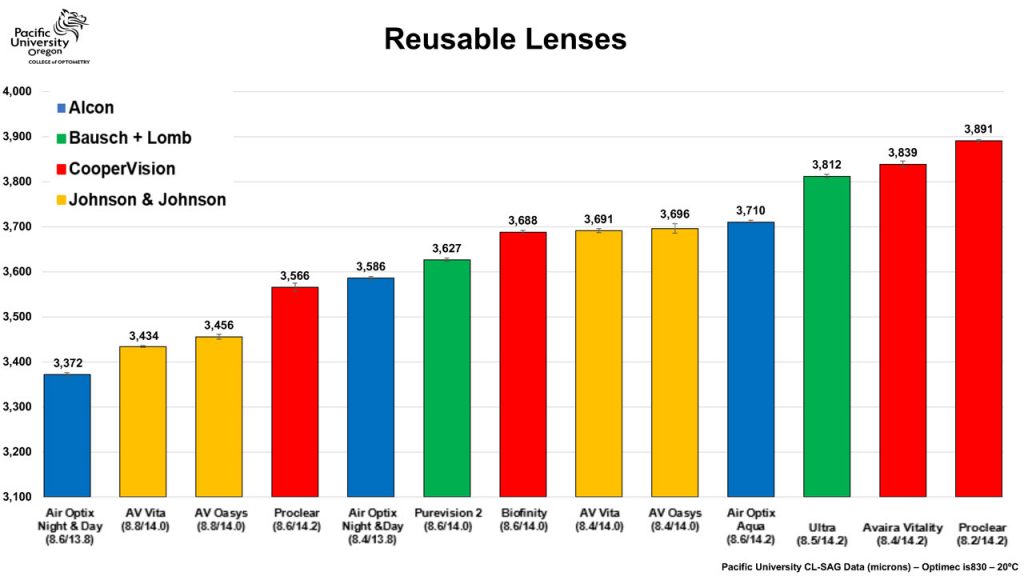
Looking at the graph showing reusable lenses in figure 2, we see a nice linear increase in CL-SAG values ‘to play with.’ (daily disposable and toric lens graphs are available too. For reusable lenses, these are the tools we have in our toolbox – eg, the total range from flattest (lowest CL-SAG) to deepest (highest CL-SAG) is about 500 microns. What we also see is that some 8.4 mm lenses (Air Optix Night & Day) have lower CL-SAG values compared to some 8.6 mm lenses (Air Optix Aqua). Normally in clinical practice, an 8.6 is considered a flatter lens than an 8.4, but that is not represented by this data. This mostly has to do with the fact that the lens diameter is different of course, but other lenses with the same base curve and diameter can also show major variations in CL-SAG values. This most likely has to do with differences in lens material that cause the lens to behave in a different manner on the eye. But this also means that base curve values are relative terms that should not be used as absolute values in contact lens practice.
Delta-SAG
The factor that is unclear now is how much the CL-SAG value needs to be altered compared to the OC-SAG to obtain a good lens fit, e.g. how big the ‘gap’ is between the ocular surface and the lens (which is called the delta-SAG). So, the new ‘fitting rule’ could be to take the OC-SAG and then add ‘x’. It is important to note, that this should be done over the chord of the diameter of the lens. If the desired soft lens to be fitted is 14.2 mm in diameter, that should be the default OC-SAG to work with. We assume from previous studies that the lens must be somewhat ‘steeper’ than the ocular surface to create mechanical pressure or ‘grip’ of the lens on the slippery ocular surface (with gravity and eyelid forces present). By how much is difficult to say, as it appears to be dependent on several factors, including soft lens design, lens thickness, manufacturing method, edge lift and material properties such as modulus and water content but also surface treatment, etc. It appears that there is not one delta-SAG value, but it varies per lens and certainly seems to vary with lens manufacturing method (lathe-cut versus moulded lenses). Possibly, the first method (lathe-cut) requires a different delta-SAG value compared to moulded lenses, as a general rule – as the material used for moulded lenses is different from that of lathe-cut lenses, and differences in surface characteristics may be present as well.
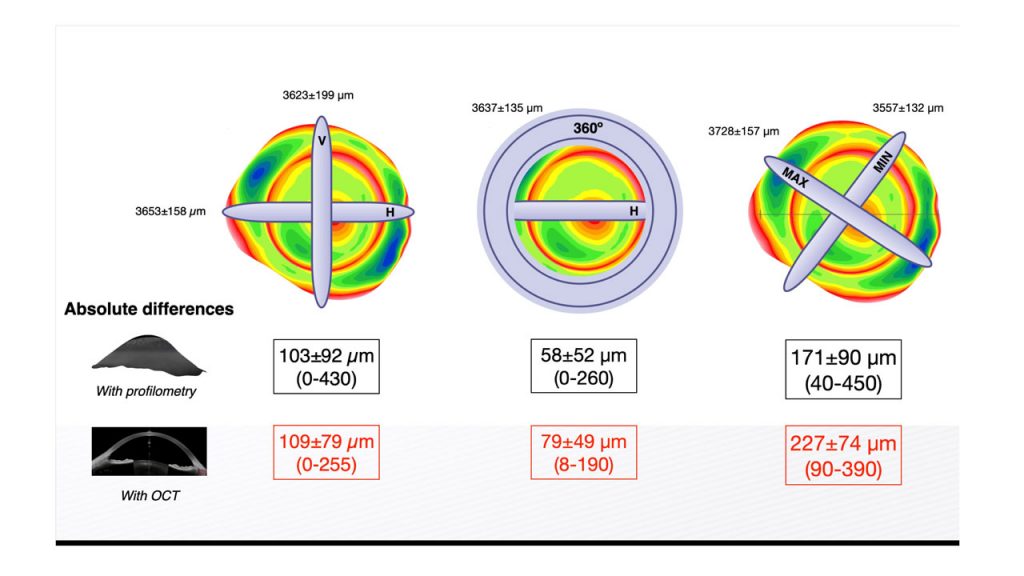
What also plays a role is that the horizontal OC-SAG value alone is not enough if we want to match this with the CL-SAG directly. Rojas et al. recently showed that if we only measure the horizontal (H) OC-SAG, the absolute differences with the vertical meridian over a 15 mm chord with profilometry and with OCT are, respectively, 103±92 microns and 109±79 microns (see figure 3). If the H OC-SAG is compared to the mean 360° value (all meridians together), the difference is smaller (58±52 microns with profilometry, 79±47 microns with OCT). To complete this story, the maximum difference in any meridian on the ocular surface, for comparison, is 171±90 microns with profilometry and 227±74 microns with OCT. This means we are making a small ‘error’ if we measure one meridian alone; it would be better to measure the ocular surface in a 360° manner if we want to match the OC-SAG values directly with CL-SAG values. In addition, it would be better to use the 34 °C values (earlier referred to in this article) than the 20 °C values to have the most accurate lens data to match that of the eye.
One Step Up
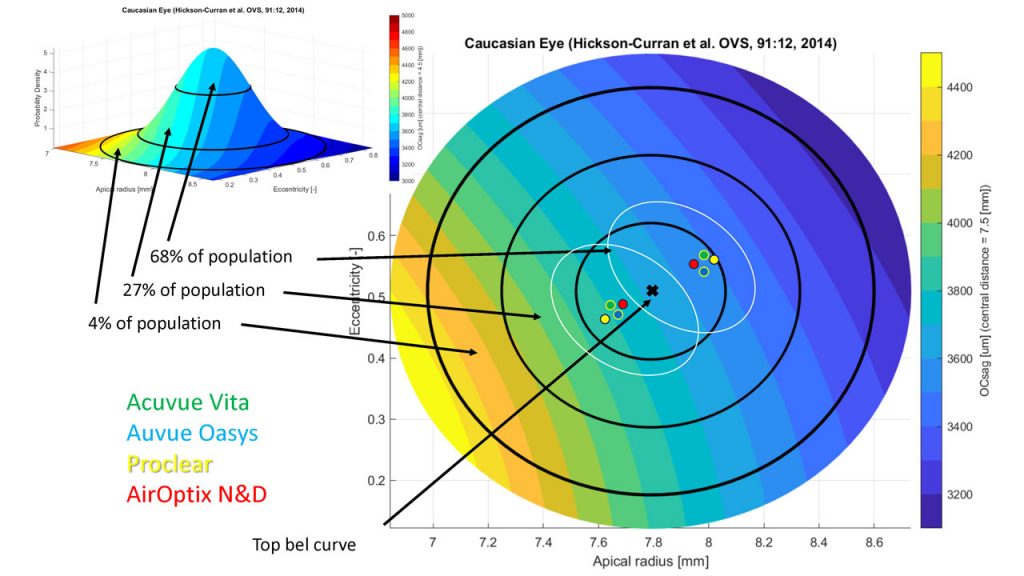
The next step in the ‘AI’ or ‘big data’ process for soft lenses is to plot the OC-SAG values of normal eyes against the CL-SAG values, as we have done in figure 4. OC-SAG values over a 15 mm chord are presented on the y-axis on the right-side. To match the 15 mm chord data of the eye, the lenses were ‘converted’ from their habitual diameter to 15 mm (using an average tangent angle of the normal eye). The distribution of the ‘normal eye’ Gaussian curve (shown on the top left) is spread out across the graph. When standard commercially available lenses come in two base curves (in the old terminology) and we add them to the graph, assuming that they will cover the ‘normal eye’ data, we can see that most lens types are very similar to each other. The white ovals can presumably represent the clinical application range. In other words: this would be the area where these standard lenses match standard eyes. Outside of this, it is the assumption that specialty lenses are needed; most likely this is the case for the 27% and 4% zones (respectively more than one and two standard deviations outside the ‘normal.’)
What all this shows, again, is that standard commercially available soft lenses have consistently found their position in the ‘normal range’ arena, covering the ‘top of the bell-curve.’ These may be the first lenses of choice (especially since they can be made in high-volume, cast-moulded and frequent-replacement modalities). But this also means that non-standard eyes require an out-of-standard lens. From the data we have on ocular surface shape (and from scleral lens fitting and design), it appears that adapting a tangent angle approach for the lens to ‘land’ on the ocular surface, and optimizing the lens by both altering the tangent angle and the sagittal height of the lens, would be our best option to create a ‘custom-made’ device that aligns best with the ocular surface – almost mimicking fitting a scleral lens with a soft material. One major issue previously had been that these lenses were limited in both material and replacement frequency.
But now it is possible to make these lenses in silicone hydrogel materials (if desired) and in an up to monthly replaceable modality. Hundreds of back surfaces can be produced to match out-of-standard eyes. In that sense, the future of a fully customized soft lens is already here for eyes that are out-of-standard.
In Closing
Soft lens fitting is all about the interaction between two surfaces: the posterior side of the lens and the anterior ocular surface. The back side of the lens, which is flexible to some degree, needs to conform to the shape of the ocular surface. It begins with the latter: by defining and ‘finding the normal eye,’ for which standard soft lenses are often the best option. To obtain an optimal outcome with these standard lenses, we speculate that the CL-SAG value has to be somewhat higher than the OC-SAG by an unknown factor that is dependent on lens material and supposedly on manufacturing method. In fact, currently there are many unknown factors that we need to resolve to come up with a ‘fixed number’ for the delta-SAG. The process of optimizing that is referred to as Finding DORY: ‘Depth of Optimized Reservoir Yieldage (in microns).
But if this interaction can be controlled, then we can create the most optimal lens in terms of clinical impact and corneal physiological outcome. A recent study out of The Ohio State University in the US, which will be presented at ARVO in Seattle, shows that lenses that fit ‘tighter,’ defined by having a higher delta-SAG (flatter ocular surfaces with standard soft lenses), show more corneal infiltrative events (CIEs), which are a result of minor corneal inflammation. The theme of the 2024 ARVO meeting is ‘vision for the future,’ a theme that nicely applies to our contact lens industry and the topic of this article.
In addition, better centration and more control over lens flexure on the eye may result in better visual performance of the lens. This is even more so the case for the more challenging or ‘out-of-standard’ eyes. Here, out-of-standard or custom-made lenses can make a major difference. In other words, there is much to gain in optimizing soft lens fitting and knowing when to divert from standard lenses in eyes that are on the left and right sides of the bell-curve of normal eyes. It may therefore be time for the revival of soft lens customization, using new terminology and improved fitting techniques, the latest technology and sophisticated software. Truly, (a) vision for the future.
Acknowledgements
Special thanks to Mari Fujimoto, Beth Kinoshita, Matthew Lampa, Patrick Caroline from the Pacific University College of Optometry Research Group in Oregon (US) and Ben Coldrick from Optimec Ltd (UK) from the data provided on the CL-SAG values and to Javi Rojas for permission to reshare his work on OC-SAG values in different meridians.
References
1 Hood DC, Durbin M, Lee C, Gomide G, La Bruna S, Chaglasian M, Tsamis E. Toward a Real-world Optical Coherence Tomography Reference Database: Optometric Practices as a Source of Healthy Eyes. Optom Vis Sci. 2023 Aug 1;100(8):499-506. doi: 10.1097/OPX.0000000000002049. Epub 2023 Jul 27. PMID: 37499165.
2 Huang AS, Hirabayashi K, Barna L, Parikh D, Pasquale LR. Assessment of a Large Language Model’s Responses to Questions and Cases About Glaucoma and Retina Management. JAMA Ophthalmol. 2024 Feb 22:e236917.
3 Sorbara L, Maram J, Fonn D, Woods C, Simpson T. Metrics of the normal cornea: anterior segment imaging with the Visante OCT. Clin Exp Optom. 2010; 93:150-6. (n=40).
4 Achong-Coan R, Caroline PJ, Kinoshita B, Copilevitz L, Lampa M, Kojima R, Andre M (2012) How do normal and keratoconic eyes differ in shape? Poster GSLS; January 26-29, Las Vegas, USA. (n=55)..*
5 Hall LA, Hunt C, Young G, Wolffsohn J. Factors affecting corneoscleral topography. Invest Ophthalmol Vis Sci. 2013; 54:3691-701. (n=50).*6 Ritzmann M, Caroline PJ, Börret R, Korszen E. An analysis of anterior scleral shape and its role in the design and fitting of scleral contact lenses. Cont Lens Anterior Eye. 2018 Apr;41(2):205-213. (n=39).
7 Van der Worp E, Hulscher. Speed Date – CL-SAG meets OC-SAG: part I. Global Contact. 2015; No.68(2), 34-5. (n=86).
8 Van der Worp E. Reaching for the Stars. Global Contact. 2017; No.70(2), 30-2. (n=214).
9 Harkness, Ritzmann, Caroline, Kojima, Hayes. Comparison of Sagittal Height Measurement Methods and Predicting Central Clearance for Scleral Contact Lenses. Master thesis, Pacific University 2015. (n=52).
10 Michaud L, Tremblay C, Grégoire S, van der Worp E, Wolffsohn J, Mertz C. Relationship between Ocular Sagittal Height and Soft Contact Lens Sagittal Depth to Improve Fitting and Comfort. Poster American Academy Optometry, Chicago – Oct 2017. (n=14).
11 Kern D. Pentacam CSP data., average OC-SAG data between flat and steep meridian. Oculus (Germany). 2018. Data on file. (n=32).
12 Dutta D, Amankwah C, Almasyabi J. Aston University Birmingham (UK) study. Medmont OC-SAG H 15mm chord. 2024. Data on file. (n=147).
13 Rojas J, van der Worp E, Piñero D. OC-SAG values in 360 degrees. Poster Global Specialty Lens Symposium 2024, Las Vegas (USA). (n=50).
14 Ortiz-Peregrina, Cruz-Crespo JJ, García-Gamero A, Rodríguez-Farfach F, Bolívar-Parra J, Ghinea R. Changing the paradigm of soft contact lens fitting: a sagittal height-based approach. Stydy at University of Granada, Department of Optics, Faculty of Sciences, Grenada (Spain). Presented at Coopervision Optistudents Awards, Budapest 2023. (n=92).
15 Fujimoto, Van der Worp, Kinoshita, Lampa, Coldrick, Caroline – Variation in daily disposable soft contact lens sagittal depth and other lens parameters at room and on-eye temperature.
16 Rojas, van der Worp, Piñero – To analyze the differences of ocular sagittal height values (OC-SAG) in different meridians and in the 360 degrees. Global Specialty Lens Symposium (poster).

Eef van der Worp
BOptom, PhD, FAAO, FIACLE, FBCLA, FSLS is an educator and researcher. He received his optometry degree from the Hogeschool van Utrecht in the Netherlands (NL) and has served as a head of the contact lens department at the school for over eight years. He received his PhD from the University of Maastricht (NL) in 2008.
He is a fellow of the AAO, IACLE, BCLA and the SLS. He is currently adjunct Professor at the University of Montreal University College of Optometry (CA) and adjunct assistant Professor at Pacific University College of Optometry (Oregon, USA). He lectures extensively worldwide and is a guest lecturer at a number of Universities in the US and Europe.

Bart van der Linden
MSc PhD, is Managing Director / CEO of Menicon, the Netherlands (NL). He received his PhD in Biomechanical Engineering at the University of Twente (NL). Bart started his career at Menicon (formerly known as NKL) 25 years ago as product and process engineer for the development of made to order contact lenses and the process of manufacturing and the software supported fitting of lenses. He has developed several GP, made-to-order (MTO) soft, and scleral lens designs or under his management, creating a full portfolio of MTO lenses for the Menicon group globally. Since 2012 he is (technical) managing director.